2011-01-23

The Swiss Ban on Minarets Confirms the Contact Hypothesis


In November 2009, Switzerland held a referendum that sought approval for a constitutional ban on minarets. 57.5% of the voters supported the ban. The ban was supported by the Swiss right wing party SVP. Poster ads that supported the ban used images as the ones below, tapping on anti-muslim sentiments and on diffuse fear towards muslims. Thus, the referendum has been widely interpreted as a vote against foreigners by the media.

A student of mine, Michael Jäckli, had the idea to use archival polling data from the referendum for a test of Alport's Contact Hypothesis. It suggests that "interpersonal contact is one of the most effective ways to reduce prejudice between majority and minority group members". Thus, Swiss municipalities (the smallest unit for which polling data is available from the Swiss bureau of statistics) with a low percentage of foreign nationals should show a high rate of approval of the ban, while municipalities with a high percentage of foreigners should show a lower rate of approval.
In order to test this assumption, Michael obtained the agreement to the ban on the municipal level from the Swiss bureau of statistics, along with indicators for educational level and social-economic status for the municipalities. He was then able to regress the agreement for the ban on the percentage of foreigners:
As visible in the plot, municipalities with a below-average percentage of foreigners tended to accept the ban at above-average levels. Without controlling for other variables, an increase of the percentage of foreigners in a municipality by 1% would decrease its agreement to the ban by 0.37%.
As lower education and social status is usually associated with more right-wing political views, Michael tested whether the negative relationship between the percentage of foreigners and the approval of the ban still holds under statistical control of these two variables. The according stepwise hierarchical regression is presented below.
It reveals that low economic status and low educational levels are indeed associated with an acceptance of the ban. But even if these factors are controlled for, there is still a significant yet small negative effect of the percentage of foreigners on the approval of the ban: Municipalities with a low percentage of foreigners tended to support the ban.
Why does an increase of the percentage of foreigners decrease the support for the ban on minarets? Possibly because municipalities can profit from their foreign population: An inspection of the bivariate correlations of the measurement variables (see below) reveals that the percentage of foreigners is associated with higher levels of education and social-economic status.
The R code that produced these results can be found below. Michael's data set can be downloaded in .CSV-Format here.

# import the data

minarettdata <- read.csv(file = "minarettdata.csv")


# inspect the data

head(minarettdata)

length(minarettdata$municipality_nr)


# make the data available

attach(minarettdata)


# generate the plot

plot(foreigners, minarett_approval, main = "Approval of the minaret ban in all Swiss municipalities\nas a function of municipal share of foreign nationals", xlab = "Municipal share of foreign nationals (in %)", ylab = "Municipal share of voters approving the ban (in %)")

abline(lm(minarett_approval ~ foreigners), col = "blue")

abline(h = 57.5, lty = 2)

abline(v = 22, lty = 2)

text(x = 60, y= 48, round(coef(lm(minarett_approval ~ foreigners))[2], digits = 2), col = "blue")

text(x = 22, y = 26, "Swiss-wide share of foreign nationals (22%)", cex = .70, pos = 4)

text(x = 49, y = 60, "Swiss-wide approval of the\nban on minarets (57.5%)", cex = .70, pos = 4)


mean(foreigners)

mean(minarett_approval)


# test the stepwise regression

library(QuantPsyc)

lmodel.1 <- lm(minarett_approval ~ SES + edu_level)

summary(lmodel.1)

lm.beta(lmodel.1)


lmodel.2 <- lm(minarett_approval ~ SES + edu_level + foreigners)

summary(lmodel.2)

lm.beta(lmodel.2)


# determine the significance of the increase in R-squared

anova(lmodel.1, lmodel.2)


# print the correlation table

corstarsl2(minarettdata[,2:5])

library(xtable)

xtable(print(corstarsl2(minarettdata[,2:5])))


# clean up

rm(minarettdata, lmodel.1, lmodel.2)


Labels: , ,

2009-11-14

Aus dem Kontext gerissen: Eine Meldung zu einer Facebook-Studie und ihre Geschichte

(special circumstances require a post in German)

Unsere Studie gibt die Interpretation, dass "Facebook-Verweigerer" (Morgenpost) mehr Berufserfolg als Facebook-Nutzer hätten, nicht her
.

Im Jahr 2007 publizierten Ellison, Steinfield und Lampe eine Studie [1], in der sie einen Zusammenhang zwischen der Nutzungsintensität der Online-Plattform Facebook und dem sozialen Kapital von amerikanischen College-Studenten feststellten. Dies könne sich wiederum positiv in anderen Lebensbereichen auswirken. Zitat: "our findings demonstrate a robust connection between Facebook usage and indicators of social capital, especially of the bridging type. ... Such connections could have strong payoffs in terms of jobs, internships, and other opportunities" (S. 1164).

Meine Studentin Anett Cepela kam auf die Idee, die Studie zu replizieren. Mich wunderte an der Original-Studie, dass die Autoren die Nutzung von Facebook als unabhängige Variable verwendeten, d.h., die Nutzungsintensität von Facebook nicht mit weiteren Variablen erklärten.

Ich schlug daraufhin vor, die Studie um einen Persönlichkeitsfragebogen zu erweitern. Wir erstellten einen neuen Fragebogen, der die Skalen der Originalautoren verwendete: Facebook-Nutzungsintensität, soziales Kapital (bridging, bonding, maintaining), Selbstwert, und Lebenszufriedenheit. Zusätzlich enthielt er die "Big Five" Persönlichkeitsmerkmale Extraversion, Neurotizismus, Gewissenhaftigkeit, Verträglichkeit und Offenheit. [2]. Der Fragebogen war so gestaltet, dass zu Anfang gefragt wurde, ob man ein Profil auf Facebook habe. Wurde diese Frage mit Nein beantwortet, wurde gefragt, ob ein Profil auf einer anderen Plattform bestünde. Es folgten die Fragen zur Nutzungsintensität von Facebook oder, alternativ bei den Nutzern anderer Plattformen, zur Nutzungsintensität der am häufigsten genutzten Plattform. TeilnehmerInnen, die nirgends ein Profil hatten, wurden nicht nach Nutzungsintensität gefragt, konnten aber die anderen Skalen des Fragebogens beantworten. Die Zürcher Pendlerzeitung "20 Minuten" druckte einen Aufruf zur Teilnahme in ihrer Printausgabe.

Ca. 1000 Personen füllten den Fragebogen zumindest teilweise aus. Wir erhielten 681 vollständig ausgefüllte Fragebögen, davon 345 von weiblichen und 336 von männlichen Personen. Das Alter unser Befragten reichte von 13 bis 89 Jahre, mit einem Durchschnittsalter von 27 Jahren. 573 der Befragten gaben an, ein Profil bei Facebook zu haben. Davon hatten mehr als die Hälfte (335) noch ein Profil auf einem anderen sozialen Netz (z.B. mySpace oder XING). 46 der Befragten hatten kein Profil bei Facebook, aber bei einem anderen Netzwerk. Nur 62 Personen gaben an, überhaupt kein Profil auf irgendeinem sozialen Netzwerk zu haben. Letztere waren im Durchschnitt 37 Jahre alt, die Nutzer von sozialen Netzwerken waren im Durchschnitt 26 und gaben an, im Durchschnitt 187 Freunde auf ihrem meistbenutzten sozialen Netzwerk zu haben.

Wir haben anschliessend für die Nutzer von sozialen Netzwerken analysiert, welche Faktoren ihre Lebenszufriedenheit beeinflussen. Genau genommen haben wir ein Strukturgleichungsmodell in LISREL mit den latenten Variablen Extraversion, soziales Kapital, Facebooknutzung und Lebenszufriedenheit berechnet. Wir verwendeten zur Parameterschätzung den WLS-Algorithmus für ordinal skalierte Daten [3].

Im Ergebnis zeigt sich tatsächlich, dass eine höhere Nutzungsintensität (mehr Freunde, mehr Zeit auf der Plattform) dazu führt, dass die Nutzer über mehr soziales Kapital verfügen und zufriedener sind, wenn man ihre Persönlichkeit ausser acht lässt. Nimmt man jedoch die Extraversion als Persönlichkeitseigenschaft in die Berechnung auf, verschwinden die Zusammenhänge fast gänzlich: Je stärker die Extraversion eines Menschen, desto mehr soziales Kapital hat er, und desto mehr ist er auf Facebook unterwegs und desto zufriedener ist er. Aber diese drei Dinge hängen vor allem von der Persönlichkeit ab. Die Effekte der Facebook-Nutzung auf das soziale Kapital und auf die Lebenszufriedenheit sind unter Berücksichtigung der Effekte der Extraversion kaum vorhanden. Genau gesagt: Der standardisierte ß-Koeffizient zwischen Facebook-Nutzung und bridging social capital beträgt in Gegenwart der Extraversion nur 0.08. Laut Cohen [4] kann man bei Korrelationen unter .10 nicht mal mehr von einem schwachen Effekt sprechen.

Das war das zentrale Ergebnis unserer Studie. Dieses Ergebnis halte ich statistisch für abgesichert und belastbar. Die Ergebnisse stehen somit im Widerspruch zu den Ergebnissen der Amerikaner.

Leider habe ich mich dazu hinreissen lassen, die 62 Personen in unserer Stichprobe, die nicht auf Facebook sind, mit den 619 Nutzern von sozialen Netzwerken (573 Facebooknutzer + den 46 Nutzer anderer Netze, die nicht auf Facebook sind) explorativ zu vergleichen. Es zeigte sich eine leicht erhöhte durchschnittliche Lebenszufriedenheit bei den Nicht-Nutzern (M = 5.39) als bei den Nutzern (M = 5.11, t(74.16) = 1.83, p = .07, Cohens d = 0.24). Dies war nicht auf Alterseffekte zurückzuführen, da Alter und Lebenszufriedenheit in der Gesamtstichprobe schwach negativ zusammen hingen (ß = -.06, p = .08). Der Unterschied zwischen den Gruppen in der Persönlichkeitseigenschaft Gewissenhaftigkeit fiel etwas deutlicher zugunsten der Nicht-Nutzer aus (t(73.70) = 2.36, p = .02, Cohen's d = .32). Allerdings gab es in der Gesamtstichprobe einen schwachen positiven Zusammenhang zwischen Alter und Gewissenhaftigkeit (ß = .12, p = .001). Deshalb kann dieser sowieso kleine Effekt auf das Alter der Teilnehmer in den unterschiedlichen Nutzergruppen zurück geführt werden. Alle Analysen, die ich in diesem Absatz berichtet habe, habe ich explorativ gerechnet. Die Effekte sind schwach und aufgrund der sehr kleinen Gruppe der Nicht-Nutzer (62 Personen) nicht belastbar. Von Repräsentativität ganz zu schweigen.

Nun habe ich einer Mitarbeiterin unser Kommunikationsabteilung ein Interview zu den Ergebnissen unserer Studie gegeben, deren Ergebnisse noch nicht mal publiziert sind. Das war wahrscheinlich mein zweiter Fehler. Der dritte Fehler war, im Interview nicht nur die belastbaren Ergebnisse zu berichten, sondern auch die explorativen. Ich habe dabei auch Studienergebnisse von dritter Seite berichtet [5], die einen Zusammenhang zwischen Gewissenhaftigkeit und Berufserfolg herstellen. Ich habe mich dabei zu der Aussage hinreissen lassen, dass man vermuten könnte, dass Facebook-Nutzer weniger Gewissenhaft seien und weniger Berufserfolg hätten, als Nicht-Nutzer. Ich habe das sofort relativiert, indem ich auf den Alterseffekt und auf die sehr kleine Gruppe der Nicht-Nutzer hingewiesen habe. In dem Artikel, den die Kommunikationsabteilung unserer Universität geschrieben hat, wurden die explorativen Ergebnisse auch erst am Schluss berichtet. Dort steht:
Und wie fühlen sich die Nicht-Nutzer von Facebook? Von den total 681 Befragten hatten 46 kein Profil bei Facebook, jedoch bei einem anderen Netzwerk, und 62 gaben an, überhaupt kein Profil auf irgendeinem sozialen Netzwerk zu haben.
«Aufgrund der kleinen Anzahl der Teilnehmer gänzlich ohne Facebook-Erfahrung muss man die Aussagen zu dieser Gruppe mit Vorsicht geniessen», warnt Meyer. Doch könne man sagen, dass der sich abzeichnende Trend eine interessante Implikation habe: Mehrere Studien zeigen, dass Gewissenhaftigkeit – eines der Big-Five-Merkmale – positiv mit dem Berufserfolg zusammenhängt.

Die Ergebnisse der Facebook-Studie legen nun nahe, dass die Nicht-Nutzer eher gewissenhaft sind. Daraus könne man rückfolgern, dass engagierte Facebook-Nutzer weniger Berufserfolg haben als solche, die Facebook wenig oder gar nicht nutzen. «Denn Menschen, die nicht auf sozialen Netzwerken sind, sind gewissenhafter und sie haben in der Regel mehr Berufserfolg», so Meyer. Allerdings sind sie auch älter als die Facebook-Nutzer, was bei diesen Ergebnissen eine Rolle spielen könnte. Weitere Studien sollen mehr Klarheit bringen.
Das ist so weit in Ordnung. Der Satz «Denn Menschen, die nicht auf sozialen Netzwerken sind, sind gewissenhafter und sie haben in der Regel mehr Berufserfolg» gilt natürlich nur in den genannten Beschränkungen. Ich wünschte nur, ich hätte ihn so nicht stehen lassen. Die Presse hat den Bericht aufgegriffen. Aus "Facebook allein macht nicht glücklich" wurde erst "Facebook macht nicht glücklich". Beim Tagesanzeiger konnte ich den entsprechenden Artikel noch korrigieren lassen, aber die Agenturmeldung der SDA war nicht mehr aufzuhalten. Auf Google News finden sich schon 37 Meldungen, wenn man nach "Universität Zürich Facebook Studie" sucht. Die Studie wurde von den Medien gierig aufgenommen und auf den verhängnisvollen Satz reduziert:

"Erfolgreicher im Beruf - ohne Facebook" (Berliner Morgenpost)

"Facebook-Verweigerer sind erfolgreicher im Job" (Welt Online)

"Forscher streiten über Facebook-Studie" (Express)

"Studie: Facebook-Muffel im Job erfolgreicher" (Bild - allerdings neben der Schlagzeile noch einer der richtigsten Artikel)

Bei der NZZ ist unter dem verkürzten Titel "Facebook macht nicht glücklich" immerhin aufgefallen, dass die verschwindend kleine Anzahl der Nicht-Nutzer in unserer Studie in der Presse irgendwie verloren ging. Den Redakteuren beim Handelsblatt war das auch egal ("Facebook macht nicht glücklicher").

Das wird mir eine Lehre sein. So wird ein Satz aus dem Kontext gerissen und zu einer Meldung. Unsere Studie gibt die Interpretation, dass "Facebook-Verweigerer" (Morgenpost) besser im Job als Facebook-Nutzer seien, nicht her. So steht es jetzt aber überall im Internet zu lesen. Ich werde mich nie wieder vor der Presse zu Spekulationen hinreissen lassen. Und ich berichte nicht noch mal von Ergebnissen, bevor sie publiziert sind.

[1] Ellison, N., Steinfield, C., & Lampe, C. (2007). The benefits of facebook "friends:" Social capital and college students' use of online social network sites. Journal of Computer-Mediated Communication, 12, 1143-1168.

[2] Körner, A., Geyer, M., Roth, M., Drapeau, M., Schmutzer, G., Albani, C., . (2008). Persönlichkeitsdiagnostik mit dem NEO-Fünf-Faktoren-Inventar: Die 30-Item Kurzversion (NEO-FFI-30). Psychotherapie, Psychosomatik, medizinische Psychologie, 58, 238-245.

[3] Jöreskog, K. G., & Sörbom, D. (1993). Structural equation modeling with the simplis command language. Hillsdale, NJ: Lawrence Erlbaum Associates.

[4] Cohen, J. (1988). Statistical power analysis for the behavioral sciences. Hillsdale, NJ: Lawrence Erlbaum.

[5] Barrick, M., & Mount, M. (1991). The Big Five personality dimensions and job performance: A meta-analysis. Personnel Psychology, 44, 1-26.

Labels: , ,

2009-10-17

SPSS / PASW Statistics 18 for Mac: The Same Junk as Always

So I write this rant about the horrors of SPSS 16 for Mac. As a result, SPSS Inc. invite me into their beta program for SPSS 17 and offer a free license for it in return. Fair enough. I participate in the program, do all their required testing and submit plenty of bugs. The time window for their beta testers is four weeks. Four weeks. I find that way too short but thats how they operate.

After the end of the beta testing, I never received my free license. I sent them one e-mail about it that was never answered. So when they invited me into their SPSS (which is now called PASW: Predictive Analysis Software) 18 beta, I didn't do anything.

So now PASW 18 ships and I install it with a screen shot app at hand. The first thing I see is this readme window (underlining added by me):
Wow. They still cannot handle foreign characters. I complained about that two versions ago. A company that is producing a statistics software is unable to display a text file containing ä, ö, and ü correctly.

After the install finishes, PASW 18 Mac launches with this gem (you will have to click on it for the large version to see what I mean):

Look at the shadows of "PASW" in the top blue bar and the red line next to it. They are pixelated! These images were obviously produced for a smaller resolution but were magnified to the current size, producing this highly unprofessional experience. So the first two impressions I get give me a feeling that not much care has gone into the production of this software. Attention to detail: Nope, sorry.

The data window features new icons at the top as one can see on the following image.
Unfortunately, that was the only time I ever saw it. After the install, I quit SPSS PASW. Every time I have launched it since them (including after reboots), SPSS PASW crashes on start up:
It. Crashes. On. Every. Launch. On my MacBook Pro (2.33 GHz, 4GB RAM, Mac OS X 10.5.8), SPSS PASW 18 is inoperable. What an enormous piece of junk.

Labels: , ,

2009-10-15

Virtual Reality Social Psychology

Today I had the pleasure of giving a talk at the Institute of Work and Organizational Psychology at the University of Neuchâtel (Institute de Psychologie du Travail et des Organisations (IPTO), Université de Neuchâtel). See here. I was invited by Prof. Marianne Schmid Mast and had the opportunity to see her laboratory and meet her cool team before my talk. In Neuchâtel, they do something I had never seen before: Virtual reality social psychology.

Social psychology studies, among other things, the interactions between individuals. Which is a challenge for laboratory research, because it adds a large amount of complexity (and costs) to experiments. For example, if a researcher wants to study the effects of group diversity on group performance, each observation requires not a single participant, but an entire group of participants. If a researcher wants to study a behavior that is evoked by a specific social interaction, it gets even more complicated: Suppose a researcher thinks that individuals will share less information with an incompetent supervisor than with a competent supervisor. An according experiment would require a supervisor who is either competent or incompetent in every experiment. Also, this supervisor should possibly exhibit the same interactions towards all experimental participants in one condition. One way of doing this is by hiring an actor for the role of the supervisor, which is often not feasible.

At Prof. Schmid Mast's Lab, they do such studies in a different way. They use virtual reality; a 3D virtual immersive environment. The experiment participant wears a head-mounted display (HMD) that gives him or her her the impression of being in another world. In this virtual world, one can interact with avatars, virtual representations of individuals. Those are programmed by the experimenters in such a way that they exhibit a certain interpersonal behavior, which is of course always constant and fully controllable by the experimenters. At the same time, the system logs data that is difficult to acquire in normal laboratory settings, such as interpersonal spatial distance between the participant and the avatars. In combination with verbal codings of the participant, one gets an extremely rich and reliable source for social interaction data.

Below is a picture of me trying it out. There is a diagram showing how the system works in the background: Four cameras pick up the infrared signal that the blue LED at the back of the HMD emits. A highly sensitive motion sensor (the little blue box next to the LED) picks up the tiniest movement of the head. These data are combined by the tracking computer in order to determine the spatial position of the participant. A second computer renders the environment accordingly and projects it in 3D into the HMD (visible on the second picture on the right screen in the background). The graphics are extremely good, I'd say they match current high-quality ego-shooter games.


The possibilities of such an experimental paradigm are endless. For example, I was in a virtual world where my own avatar was a woman. I could see my reflection in a mirror and it would correspond to my head movements (the face was almost photorealistic), but it wasn't me - it was this other person. The experience was insofar fascinating as it felt extremely real. In another scenario, I found myself standing on a narrow wooden board across a crater in the street. The crater was about 30m deep and 10m in diameter. I could see to its bottom - I was standing above this gaping hole. On a narrow piece of wood. I could feel the vertigo and my palms started to sweat. When the experimenter asked me to jump into the abyss, I couldn't. I knew that this was only virtual and the graphics looked more like the ego shooter that my brother used to play but still - I couldn't get myself to jump off the board for a couple of minutes. It felt that real.

Only an imbecile would not see the possibilities of such a technology for psychological research. Body image. Behavior therapy. Social interactions. I am sure that in a couple of years, the employment of 3D VR environments for psychological research will be as common as the use of fMRI today. Just that spending half an hour in a virtual world is much more fun than spending ten minutes inside the narrow tube of a scanner.

Labels: , , ,

2009-08-12

An R Function for the Blau Index of Diversity

In diversity research, one is often interested in how an individual feature is distributed among the members of a group. In other words, one is interested in how diverse a group is with regard to that feature. If the particular feature can be expressed in a metric way, e.g. age or organizational tenure, researchers use measures of dispersion for quantifying the diversity of a group with regard to that feature. For example, the standard deviation of the average age of group members can be employed to indicate the age diversity of a group.

If researchers wish to quantify the diversity of a group with regard to a nominal feature, such as ethnicity, gender, or education, they usually employ the Blau Index (Blau, 1977). The Blau Index is calculated by
where p is the proportion of group members in a given category and i is the number of different categories of the feature across all groups. If a group is homogeneous with regard to the feature in question, i.e., if all group members have the same nationality, the Blau Index of the group for nationality is 0. If all members of the group have a different nationality, the Blau Index of that group for nationality approaches 1. The maximum Blau Index for a feature in a given data set depends on the number of categories of that feature in the data set.

A number of studies have linked the Blau Index of (management-) teams to team processes and team outcomes (e.g., Bantel & Jackson, 1989; Richard, Barnett, Dwyer, & Chadwick, 2004; Chandler, Honig, & Wiklund, 2005; Pitts, 2005). Threfore, I also wanted to include the Blau Index for various features in the analysis of the data I obtained in an attempt to replicate and extend a study by Homan, van Knippenberg, van Kleef, & De Dreu (2007).

In doing so, I was unable to locate an R function for calculating the Blau Index. I therefore wrote my own and thought that others might also find it useful.

The function takes two arguments:
A numeric vector, groupID, denoting the group of every person/participant in the data set.
A second vector, feat, that can be either numeric or string, denoting the expression of the feature for each person/participant in the data set.

The function returns a vector of length = number of groups with the Blau Index for each group.

Example:

groupid <- c(1,1,1,2,2,2,2)
feature <- c("male", "male", "male", "female", "female", "male", "male")

blau.index(groupid, feature)

[1] 0.0 0.5

Here is the code:

blau.index <- function(groupid, feat){
blau.index <- rep(0, length(levels(as.factor(groupid))))
if (is.numeric(feat)) { # if the feature is denoted as a numeric ordinal variable
for (i in 1:length(levels(as.factor(groupid)))){
for (j in 1:length(levels(as.factor(feat)))){
blau.index[i] <- blau.index[i] + ((sum(feat[groupid == i & feat == j])/j)/ length(feat[groupid == i]))^2
}
}
} else { # if the feature is denoted as as strings
number.of.features <- length(levels(as.factor(feat)))
feat.num <- rep(NA, times = length(as.factor(feat)))
for (i in 1:number.of.features){
feat.num[feat == levels(as.factor(feat))[i]] <- i
feat.num[is.na(feat.num)] <- (number.of.features + 1)
}
for (i in 1:length(levels(as.factor(groupid)))){
for (j in 1:length(levels(as.factor(feat.num)))){
blau.index[i] <- blau.index[i] + ((sum(feat.num[groupid == i & feat.num == j])/j)/ length(feat.num[groupid == i]))^2
}
}
}
blau.index <- (1 - blau.index)
return(blau.index)
}


I would appreciate suggestions for improvements.

References

Blau, P. M. (1977). Inequality and heterogeneity. New York, NY: Free Press.

Bantel, K., & Jackson, S. (1989). Top management and innovations in banking: does the composition of the top team make a difference? Strategic Management Journal, 10, 107–124.

Chandler, G. N., Honig, B., & Wiklund, J. (2005). Antecedents, moderators, and performance consequences of membership change in new venture teams. Journal of Business Venturing, 20, 705–725.

Homan, A. C., van Knippenberg, D., Kleef, G. A. van, & De Dreu, C. K. W. (2007). Bridging faultlines by valuing diversity: Diversity beliefs, information elaboration, and performance in diverse work groups. Journal of Applied Psychology, 92(5), 1189–1199.

Pitts, D. (2005). Diversity, representation, and performance: Evidence about race and ethnicity in public organizations. Journal of Public Administration Research and Theory, 15, 615–631.

Richard, O., Barnett, T., Dwyer, S., & Chadwick, K. (2004). Cultural diversity in management, firm performance, and the moderating role of entrepreneurial orientation dimensions. Academy of Management Journal, 47, 255–266.

Labels: , , ,

2008-09-27

How to make a list of own publications in LaTeX in APA Style with sub-headings

Your PhD is through and you apply for a post doc or, after that went through, write a grant proposal. And you have to attach a list of your own publications. You wrote everything else in LaTeX, so that should be in LaTeX as well. How do you do that in APA style and with subheadings (e.g., "Peer-reviewed journal articles", "Manusripts under review")? It took me a while to figure out so I thought I'd share it with the web. First, apacite and biblatex seem to be incompatible, so that does not work out. My solution is a combination of the apacite package and the bibunits package. This works for me:

...
\usepackage{apacite}
\usepackage{bibunits}
...

\begin{document}
\large{\flushleft Publications by Bertolt Meyer}\\

\begin{bibunit}[apacite]
\nocite{meyer2008stics,meyer2008gpir,patil2008}
\renewcommand{\refname}{\normalsize Manuscripts under review}
\putbib[blit]
\end{bibunit}

\begin{bibunit}[apacite]
\nocite{meyer2008}
\renewcommand{\refname}{\normalsize Monographies}
\putbib[blit]
\end{bibunit}

...
\end{document}


This requires a BibTeX bibliography file blit.bib in the same folder that holds the document. Somehow, a reference to my usual bibfile containing all my references didn't work, so I copied all of my own publications into a seperate bib.

Running latex over the above codes produces a sub-bibliography file bu[i] for every section, so in this case bu1 and bu2. Bibtex has to be run seperately over these two, which does not work from within TeXShop, so you have to do that from the console. The \renewcommand{\refname}{\normalsize Monographies}command changes the bibliography heading or title from "References" to something custom ("Monographies" in this case) and adjusts the font size of the bibliography heading acordingly.

Labels: ,

2008-08-20

The Finnish Husband

The husband and his group's design ideas for creating a new sense of identity for the inhabitants of the former Finnish capital Turku were mentioned quite extensively in the Finnish newspaper Turun Sanomat today. They asked a few inhabitants what they like about their city and many said that they like the river. So one of their ideas is to illuminate the river at night in order to give it a stronger presence. I don't know what the fish make of that, but the newspaper liked it. They actually used one of the husband's mock-up photos of the illuminated river on the top right of the article.

The longest Finnish word I found in the article is kulttuuripääkaupunkivuonna. I think it translates into Capital of Culture, as Turku will be the European Capital of Culture in 2011.

UPDATE: The Finnish tabloid Iltalehti also brought the story. Can someone please tell me whether they like it?

Labels: ,

My PhD thesis was published today despite copyright screw-ups

Since I embrace the concept of open access very much, I published it on the electronic document server of Humboldt-University Berlin. It can be accessed here. The great advantage of doing it this way lies in the possibility of people finding your work through a google search. By putting the document on an open access server, you make the full text available to the entire internet. Fortunately for me, my science (Psychology) is internet-dominated enough to not devalue this publiation channel. From my perspective, open access has many advataes: It is quick, cheap, and ensures the highest possible range.

However, it comes with at least one issue. My dissertation contains quite a few figures. A lot of those were taken or adapted from other sources. I thus had to seek permission to reprint from the respective copyright owners. I made the worst experience with Oxford University Press. I sent them a request to use a small diagram (boxes with text) from a book they published in 1995. Their very brief reply:
I am afraid that we would not grant permission for this as it is our policy not to allow our material to be placed upon open access websites.
Simple as that, with no further explanation whatsoever. I can understand some of the reservation that copyright owners might have, but forbidding me to use a simple figure that consists of four boxes and a swirl in an academic content just because it is available on the Internet is too much. Screw you, OUP. What year do you think it is?

Labels:

2008-08-07

Starchitecture

The husband finally has a website that displays his gorgeous architectural designs. I'm sure that he's up for quite a career.

Labels: , , ,

2008-07-16

Re: Grok or: Information, Knowledge, and Mental Models

Jack Shedd has an insightful piece on his blog concerning shared patterns of thought and language:
If you ever meet two folks who collaborate well, who can finish each other’s thoughts, chances are they share a pattern language. ... Recognizing that our language is not absolute, that labels are open to personal interpretation; Slap whatever label you’d like on it, I’ve found no better way to think of it than in the term of patterns.
This is an issue thats widely discussed in Psychology and Philosophy. It comes down to the difficult relationship between language and thought, and between knowledge and information. Consider Jack's figurative example:
The best way for me has always been to repeat back whatever idea I hear in my own words and try hard only to use terms I know I share with the person. If someone says they want a “patriotic” logo, I immediately say, “So something with red, white, and blue, maybe stars or stripes in it?” Maybe that’s what the person was thinking. Maybe not. He might have been thinking of something airy and old, with black-letter type and dark brown hues. That could be patriotic to someone who thinks of the Constitution, and not the flag, as patriotism itself. He’s no more wrong or right than I am in my definition.
But oh, what a dick I’ll look like when I turn in that blue logo with the star. The client will think he’s chosen the wrong designer, that I didn’t understand his business at all; Worse, that I didn’t listen to him. That’s the first thing everyone thinks when there’s a mismatch. They blame you and think you didn’t listen. Even if you listened perfectly. Even if you took detailed notes. Everyone always thinks it was a lack of effort on your part. That you’re somehow dense, or dumb.
From my perspective, the problem lies in different interpretative frameworks and different cognitive biographies. Both persons (subjectively) know what a patriotic logo is, but their knowledge is highly subjective and contextual. Each person has his or her own "interpretative framework" (Polanyi, 1958). In communication, this subjective knowledge structure is transformed into information that does usually not convey its full set of attributes. The German philosopher Ulf von Rauchhaupt nails it quite well in his definition of knowledge:
The interpretation of information that leads to knowledge by an individual can be seen as an organization process: The process of interpreting data as information is already an act of organization: we perceive the data, order it and link it with other informationfrom our previous knowledge.... In this way, the new information becomes a part of our knowledge for further acts of interpretation. What we know then has a higher degree of organization than the barely obtained information.... Contrariwise, knowledge becomes information again if it is expressed. In order to express knowledge, an individual cannot supply his or her entire network of previous knowledge, which consists of his or her entire history of experiences, his or her cognitive biography. In order to share and exchange knowledge, humans have to partially reduce it to information. The possibility of such a reduction, the possibility to encode knowledge into information, is the reason for the sometimes synonymous use of the terms knowledge and information. Information is a condensed form of knowledge, knowledge is information whose organization exists only for the knowing person (Rauchhaupt, 2005, p. 98f, own translation).
Note that in von Rauchhaupt’s view, knowledge is represented as a network of organized information. Jack has come up with a practical solution: He will verbalize a part of his network of previous knowledge that is connected to the information that he perceives and integrates into his network of previous knowledge. This approach has its limitations, especially if implicit knowledge is involved, but I see it as a good mental exercise that can potentially limit misunderstandings and conflict. Furthermore, I find it quite fascinating that someone arrives at a similar description of the problem based on general wisdom. Furthermore, I think that Jack's illustration nails the issue quite well.

However, I would contradict Jack's original claim that two folks who collaborate well, who can finish each other’s thoughts, share a pattern language. I would say that these two individuals share a task-relevant mental model. In research, such mental models have been operationalized (measured) as knowledge networks (graphs), in line with von Rauchhaupt's concept of a network of organized information. For example, Mathieu et al. (2000) elicited team members' mental model with a structural knowledge elicitation technique similar to my AST.

It turned out that teams in which the resulting knowledge graphs were similar, i.e. in which mental models were similar, performance was higher.

References:

Mathieu, J. E., Heffner, T. S., Goodwin, G. F., Salas, E., & Cannon-Bowers, J. A. (2000). The influence of shared mental models on team process and performance. Journal of Applied Psychology, 85(2), 273–283.

Polanyi, M. (1958). Personal knowledge. London, UK: Routledge & Kegan Paul.

Rauchhaupt, U. von. (2005). Wittgensteins Klarinette - Gegenwart und Zukunft des Wissens [Wittgenstein’s clarinet - present and future of knowledge]. Berlin, Germany: Berliner Taschenbuch Verlag.

UPDATE: Jack sent me an E-Mail and asks:
What is the distinction between a "knowledge network"
and the "pattern language"?
I should have made that clearer. The term "pattern language", as far as I understand Christopher Alexander's use of the term, is a codified (i.e. articulable, speakable) repository of methods for solving typical problems (that occur in design-related areas).

Knowledge can be defined as a set of structural connectivity patterns whose content has been viable for the attainment of goals [1].

Therefore, knowledge is always a network of components that have been referred to differently in different fields and by different scholars, but the network organization of knowledge is something that most people can agree upon.

There are similarities between the concepts pattern language and knowledge, but the difference I see between the concepts lies in the dependency of a pattern language on a codifiable language (and possibly in its dependency on a specific field of expertise). This dependency on codification becomes quite clear in Wikipedia's notion of a pattern in this context [2]:

"A single problem, documented with its best solution, is a single design pattern. Each pattern has a name, a descriptive entry, and some cross-references, much like a dictionary entry. A documented pattern must also explain why that solution is considered the best one for that problem, in the given situation."

In a pattern language, a pattern is thus something explicit and almost objectively true. Knowledge on the other other hand relies in no small parts on implicit content and connections, i.e. things we know but cannot articulate, _especially_ in the context of doing something. Consider these two sentences (example by Wittgenstein):

1. I know the height of the Mont Blanc.
2. I know how a clarinet sounds.

Both sentences constitute knowledge and both pieces of information have an entire network of associated information to them in the head of the person who says either of these sentences. However, neither the associations with these pieces of information, nor the associated items need to be explicitly available, i.e. speakable. We know more than we can say [3]. The network associated with the second sentence cannot be made explicit in such a way that a receiver who has never heard a clarinet before acquires the same knowledge as the sender.

This issue taps in the fundamental question on the relation between language and thought. Without going into too much detail, my point is: Similar knowledge structures between two individuals can lead to the point that those two individuals share a pattern language, but that must not necessarily be so, because parts of the knowledge structure cannot be articulated. However, similar knowledge structures condition successful cooperation in task performance (at least thats what some scholars claim; others, like myself, argue that a certain amount of cognitive heterogeneity between team members facilitates higher team performance).

Thus, the configuration of knowledge structures conditions the ability to work together, but the link between knowledge structures and pattern languages is not 100%, i.e. there can be diverging languages that base on similar knowledge (structure/networks). It is possible that two people can have similar knowledge, can work together, but have a different pattern language.

References

[1] Meyer, B., & Sugiyama, K. (2007). The concept of knowledge in KM: a dimensional model. Journal of Knowledge Management, 11(1), 17–35.

[2] http://en.wikipedia.org/wiki/Pattern_language#What_is_a_pattern.3F

[3] Polanyi, M. (1983). The tacit dimension (Reprinted ed.). Gloucester, MA: Smith.

Labels: , , , ,

2008-05-24

Obtaining the same ANOVA results in R as in SPSS - the difficulties with Type II and Type III sums of squares

I calculated the ANOVA results for my recent experiment with R. In brief, I assumed that women perform poorer in a simulation game (microwolrd) if under stereotype threat than men. My students who assisted in the experiments used SPSS for their calculations. I realized that they obtained different results than I did, with the same model on the same data set. As I was new to R, my initial calculation, an analysis of covariance (ANCOVA) with the dependent variable microworld performance (MWP), the treatment factors gender and stereotype threat, and the covariate reasoning ability, looked like this:

I see two significant main effects of the treatment factors, a significant effect of the covariate, and a significant interaction effect. However, Quick-R tells me this:
WARNING: R provides Type I sequential SS, not the default Type III marginal SS reported by SAS and SPSS. In a nonorthogonal design with more than one term on the right hand side of the equation order will matter (i.e., A+B and B+A will produce different results)! We will need use the drop1( ) function to produce the familiar Type III results.
I do not want order to matter and adjust my calculation accordingly:
What a difference: The main effect of the participants' gender on thir microworld performance does not reach statistical significance. However, that is still not what SPSS produces:

UNIANOVA MWP BY GENDER STTHREAT WITH reasonz
/METHOD=SSTYPE(3)
/INTERCEPT=INCLUDE
/CRITERIA=ALPHA(0.05)
/DESIGN=reasonz GENDER STTHREAT GENDER*STTHREAT.

In SPSS, the main effect of gender is still significant. I dug a little deeper and found another line I needed to add to the R command in order to get exactly the same result:

As you can see, these results are identical. But why all these differences? What does options(contrasts=c("contr.sum", "contr.poly")) actually do and what the heck are Type-III sums of squares? I surely did not learn about these things at my university. I thus did a little reading.

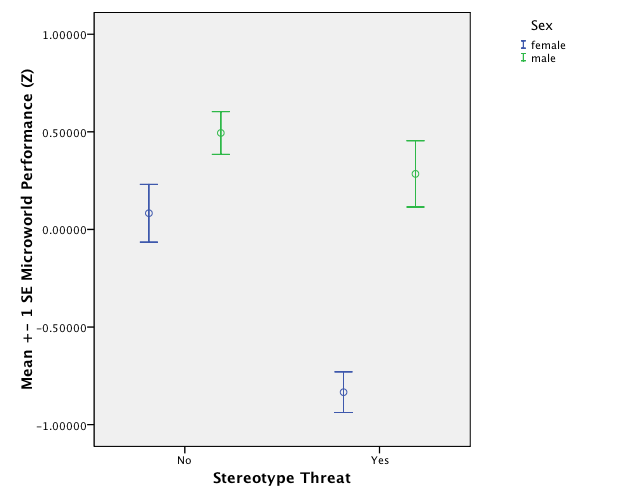
It turns out that the decision about which type of sums of squares to use is based on the question whether it is reasonable to report main effects in the presence of an interaction. Let's review the hypothesis of the experiment: It assumes that women exhibit a decrease in microworld performance under stereotype threat. This is an interaction hypothesis. An error bar plot (lines representing 1 SE) reveals that this is the case:
The plot indicates a significant interaction between gender and stereotype threat. The main effect of stereotype threat is obtained by averaging the performance scores of all participants (both male and female) over the two stereotype threat conditins. This will lead to a low average score under the stereotype threat condition because of the interaction, because the female participants score so extremely low unter stereotype threat and account for the lower average. Thus, it makes no sense to look at the main effect of stereotype threat if an interaction of stereotype threat * gender is present.

Looking for a main effect of stereotype threat under the presence of a significant interaction is a violation of the marginality principle that assumes that all terms to which a particular term is marginal are zero. Lower order terms are marginal to higher order terms, i.e. the main effects of two factors A and B are marginal to the interaction effect A*B. Thus, in this case, the marginality principle would assume that if we inspect and report main effects of gender and stereotype threat, the interaction of stereotype threat and gender is zero. That is not the case and the above example illustrates that - under the given hypothesis - it is useless to report the main effect of stereotype threat.

Now, the problom with Type-III sums of squares (also referred to as marginal sums of squares) is that they are "obtained by fitting each effect after all the other terms in the model, i.e. the Sums of Squares for each effect corrected for the other terms in the model. The marginal (Type III) Sums of Squares do not depend upon the order in which effects are specified in the model" (source). In the case with stereotype threat, that clearly doesn't make any sense: Reporting the Type III sum of squares (as SPSS does per default) for the main effect of stereotype threat means doing so while correcting for the interaction. But it is precisely this interaction that caused the main effect in the first place! Thus, Type-III sums of squares violate the principle of marginality and do not make any sense in the stereotype threat case. Even more so, Type-III sums of squares do "... NOT sum to the Sums of Squares for the model corrected for the mean". I wonder whether this renders the usual way of calculating a factor's effect size eta-square by dividing the SS of the factor by the total SS useless, too?

Anyway, coming back to the ominous contrasts=c("contr.sum", "contr.poly"): In order to obtain the correction for the rest of the factors in the model that Type-III SSs deliver, R needs to know how to balance the factors in the calculation of the SSs. Therefore, it requires a cotrast matrix with zero-sum columns (see here). The R-help for the options() command (?options()) tells us:
contrasts:
the default contrasts used in model fitting such as with aov or lm. A character vector of length two, the first giving the function to be used with unordered factors and the second the function to be used with ordered factors. By default the elements are named c("unordered", "ordered"), but the names are unused.
As the treatment factors gender and stereotype threat are unordered factors, R will use contr.sum in order to construct a contrast matrix of the apropriate order (i.e., 2), because contrasts=c("contr.sum", "contr.poly") was specified. contr.sum(2) produces

[,1]
1 1
2 -1


My first attempt at Type-III SSs in R above produced nonesense and differed from SPSS, because this wasn't specified.Without going into too much detail here (basically because I haven't yet understood everything myself), there is an alternative to the sequence-dependent Type-I SSs and the marginality-violating Type-III SSs: Type II sums of squares preserve the marginality principle. This is how to get them, and this example illustrates that they are diffrent from Type-III SSs and that they are - at least in this case - order independent:
SPSS can do the same by specifying /METHOD=SSTYPE(2) in the UNIANOVA syntax.

The remaining problem in the present case is the main effect of gender. It does make sense to investigate the effect of gender in the presenence of the interaction with stereotype threat, because it could be that women are generally poorer complex problem solvers than men and perform especially poor under stereotype threat on top of the general difference. In fact, the error bar above indicates that this is the case. This leaves me with one main effect that cannot be interpreted (stereotype threat) and another one that can be interpreted. Which SSs should I use? I am a bit lost.


Labels: , , ,

2008-04-09

Beautiful Correlation Tables in R

I have achieved another victory in getting R to produce SPSS-like results. In experimental psychology, an analysis of measurement variable correlations is a common method in the course of a statistical analysis. Thus, I wanted R to produce a publication-quality output similar to SPSS: a correlation matrix of measurement variables that contains only the lower triangle of observations, where observations have two decimal digits and are flagged with stars (*, **, and ***) according to levels of statistical significance. However, as statmethods notices:
Unfortunately, neither cor( ) or cov( ) produce tests of significance, although you can use the cor.test( ) function to test a single correlation coefficient.
I did a little research and found this post on the R-help list. I modified Chuck Cleland's code a little so that the following command on the swiss data frame (provided in the Hmisc package) produces a beautiful output:

> corstarsl(swiss[,1:4])

Fertility Agriculture Examination
Fertility
Agriculture 0.35*
Examination -0.65*** -0.69***
Education -0.66*** -0.64*** 0.70***

If one employs the xtable package that produces LaTeX tables from within R, xtable(corstarsl(swiss[,1:4])) produces this:
Isn't that beautiful? I like it a lot. Here's the code (as I said, much of it taken from here):

corstarsl <- function(x){
require(Hmisc)
x <- as.matrix(x)
R <- rcorr(x)$r
p <- rcorr(x)$P

## define notions for significance levels; spacing is important.
mystars <- ifelse(p < .001, "***", ifelse(p < .01, "** ", ifelse(p < .05, "* ", " ")))

## trunctuate the matrix that holds the correlations to two decimal
R <- format(round(cbind(rep(-1.11, ncol(x)), R), 2))[,-1]

## build a new matrix that includes the correlations with their apropriate stars
Rnew <- matrix(paste(R, mystars, sep=""), ncol=ncol(x))
diag(Rnew) <- paste(diag(R), " ", sep="")
rownames(Rnew) <- colnames(x)
colnames(Rnew) <- paste(colnames(x), "", sep="")

## remove upper triangle
Rnew <- as.matrix(Rnew)
Rnew[upper.tri(Rnew, diag = TRUE)] <- ""
Rnew <- as.data.frame(Rnew)

## remove last column and return the matrix (which is now a data frame)
Rnew <- cbind(Rnew[1:length(Rnew)-1])
return(Rnew)
}

Labels: , , ,

2008-04-08

Parachute use to prevent death and major trauma related to gravitational challenge: systematic review of randomised controlled trials

Marvelous piece mocking exaggerated demands for randomized experimental designs. Some journal review editors should definitely read this.
"Objectives: To determine whether parachutes are effective in preventing major trauma related to gravitational challenge. ... It is a truth universally acknowledged that a medical intervention justified by observational data must be in want of verification through a randomised controlled trial. ... Results: We were unable to identify any randomised controlled trials of parachute intervention. Conclusions: As with many interventions intended to prevent ill health, the effectiveness of parachutes has not been subjected to rigorous evaluation by using randomised controlled trials. Advocates of evidence based medicine have criticised the adoption of interventions evaluated by using only observational data. We think that everyone might benefit if the most radical protagonists of evidence based medicine organized and participated in a double blind, randomised, placebo controlled, crossover trial of the parachute".

Labels:

2008-04-01

More Beautiful Error Bars in R

The rather complex structure and syntax of R (at least to the spoiled SPSS user that I am) comes with a steep learning curve but also with a huge profit: Flexibility. I managed to produce multiple clustered error bars in R today that come across better than a comparable SPSS output:
With regard to my experiment, the graph shows that despite the fact that an ANOVA does not deliver a significant interaction effect of microworld and participant gender, the effect of stereotype threat varies over different microworlds. FSYS produces the smallest gender effects and exhibits the smallest (and statistically insignificant) gender differences in the no stereotype threat condition.

With regard to R, two days of extensive reading and trial-and-error (and my sketchy previous knowledge) have enabled me to achieve almost all the graphical functionality I require (ANOVA interaction plots are next). Maybe R's learning curve isn't that steep after all. What I learned today: the use of the par() function for changing R's graphic output settings and using that to create a multiple figure environment that I then filled with three custom-generated error bars.

Labels: , , , , ,

2008-03-31

Beautiful Error Bars in R

One of the reasons why I haven't made the switch from R to SPSS is R's lack of proper error bar graphs. I use them frequently because they are easy to interpret: If you plot the means of several groups of participants in one error bar chart and scale the error bars to a length of one standard measurement error, non-overlapping error bars indicate a significant difference between the according means. In fact, the APA advocates the use of error bars for reporting results since 2005 [1]. This way of reporting differences in means is also called "Inference by Eye" [1].

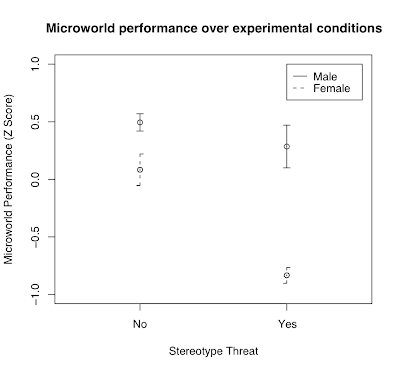
After my rants about SPSS, my wise R mentor, Stephan Kolassa, pointed me at the gplots library that features a good function for drawing error bars in R: plotCI(). Stephan also pointed me to Rseek.org, an excellent search engine for R related queries. I fiddled with Stephan's example code in order to reproduce my SPSS clustered error-bar chart from last week's post on stereotype threat in complex problem solving:


And this is how I got in in R:
I like it very much; the only thing I need to work out is how to offset the bars in the same conditions so that overlapping error bars don't actually overlap but are drawn next to each other with a few pixels between them.

If you would like to try this out for yourself, here is the R code that produces the image above:

# Clustered Error Bar for Groups of Cases.
# Example: Experimental Condition (Stereotype Threat Yes/No) x Gender (Male / Female)
# The following values would be calculated from data and are set fixed now for
# code reproduction

means.females <- c(0.08306698, -0.83376319)
stderr.females <- c(0.13655378, 0.06973371)

names(means.females) <- c("No","Yes")
names(stderr.females) <- c("No","Yes")

means.males <- c(0.4942997, 0.2845608)
stderr.males <- c(0.07493673, 0.18479661)

names(means.males) <- c("No","Yes")
names(stderr.males) <- c("No","Yes")

# Error Bar Plot

library (gplots)

# Draw the error bar for female experiment participants:
plotCI(x = means.females, uiw = stderr.females, lty = 2, xaxt ="n", xlim = c(0.5,2.5), ylim = c(-1,1), gap = 0, ylab="Microworld Performance (Z Score)", xlab="Stereotype Threat", main = "Microworld performance over experimental conditions")

# Add the males to the existing plot
plotCI(x = means.males, uiw = stderr.males, lty = 1, xaxt ="n", xlim = c(0.5,2.5), ylim = c(-1,1), gap = 0, add = TRUE)

# Draw the x-axis (omitted above)
axis(side = 1, at = 1:2, labels = names(stderr.males), cex = 0.7)

# Add legend for male and female participants
legend(2,1,legend=c("Male","Female"),lty=1:2)


[1] Cumming, G., & Finch, S. (2005). Inference by Eye: Confidence Intervals and How to Read Pictures of Data. American Psychologist, 60(2), 170–180.

Labels: , ,

A reply from SPSS Inc.

SPSS Inc. replied to my open letter on the poor quality of SPSS 16 for Mac:

Dear Bertolt:

I want to acknowledge your email/blog and apologize for the inconveniences caused by SPSS 16.0 for Mac. Your bugs, issues and suggestions have been logged and we will work on fixing them in future releases.

We are getting ready to start beta testing SPSS 17.0 for all three platforms -- Windows, Mac and Linux -- in a couple months. Would you like to participate? We would love to have your input. Beta testers get a free copy of the final software.

Thanks,
Arik

________________________
Arik J. Pelkey
Sr. Product Manager
SPSS Inc.
Phone: [deleted]
www.spss.com


________________________________

I do acknowledge the friendly mail and the fact that they didn't try to reason or to justify certain issues. However, note that they apologize for the inconvenience SPSS caused, but not for the bugs, i.e. for the quality of their software. That may sound like splitting hairs, but to me, it's a difference. Why can companies never ever say something like: "We know we screwed up big time. We're sorry." Why does it always have to be some sort of marketing speech? Anyways, I do appreciate their invitation to their beta program which I am going to accept (criticism should always be constructive, eh?).

However, I also suggested two steps on SPSS's part in my reply: Firstly, SPSS should publicly acknowledge certain issues with SPSS 16 for Mac. Secondly, I urge SPSS to review their internal processes for software testing. A more rigorous product testing would have saved them and me a lot of time and nerves.

Labels: , ,

SPSS 16 for Mac Doesn’t Make the Cut

Mark Kupferberg took up my open letter to SPSS on his Blog. He agrees with me on the poor impression that SPSS 16 for Mac's UI creates:
I haven’t personally seen SPSS 16 for the Mac, but looking at the pictures Bertolt provided, I can certainly see why one might be concerned. It really does look like something that belongs on Windows 3.1.
Some of the people who commented on my rants defended the UI for two main reasons: First, it has been this way since the first release and its good that it stays the same, and second, that it's what Windows users get, too. I think that both views are flawed, because a good piece of software can improve its UI without turning its users away. Changes to the worse have to be avoided of course, but no changes at all just for the sake of stability doesn't sound like a sound argument to me. And secondly no, the Mac UI is not what Windows users are served. The icons on Windows look similar, but they're smaller, integrate better with the overall design and the entire UI makes a more organized impression on me:

Labels: , , ,

2008-03-28

Learning R for SAS and SPSS Users

For all of those who as frustrated with SPSS as I am, decisionstats has a great tip:
So you decided to cut down on your Statistical software expenses and decided to get R.

but the problem is you know SAS /SPSS and you need to learn R fast enough to justify switching over …….

the ideal book for you is http://oit.utk.edu/scc/RforSAS&SPSSusers.pdf

Labels: , ,

2008-03-27

SPSS 16 for Mac: Insulting users. An open letter to SPSS Inc.

Dear Ladies and Gentlemen at SPSS Inc,

As a psychologist working in experimental research, the statistical analysis of data is the bread and butter of my daily work. Like the majority of my colleagues in the social sciences, I use the de-facto industry-standard for this task: SPSS; the very product your company is bulit on, the very product that is supposed to deliver a "statistical package for the social sciences" - what SPSS originally stood for before it became a brand.

Let me remind you that this is an exclusive piece of software that comes with a steep price tag of $639 for the single base version for higher-education institutions ($1699 for commercial users).

I am writing you this open letter concerning the quality of your most recent version of SPSS for the Mac - the first version that runs on intel-based Macs, SPSS 16.0 for Mac.

SPSS 16 for Mac - that I have to use on a frequent basis - is the most insulting piece of software I ever came across. I have been frequently annoyed by software in my life time, but this is the first time that I actually feel insulted by a commercial piece of software. Its astonishingly poor interface design and the long list of bugs I discovered during a single week of intense usage make me wonder whether SPSS 16 for Mac was ever used for its intended purpose at your company before you dared to ship it to us - your end users and customers. Do you think that just because we're scientists, you can throw this half-baked crap at us?

The poor impression begins right after double-clicking the icon, when SPSS displays its spalsh screen:

Non-English characters, as they appear in the name of my organization (Universität Zürich), are not displayed correctly. Your programmers have obviously never heard of proper internationalization.

Secondly, the overall appearance makes me think its 1996.

Especially the tool-bar looks exactly like I would expect a toolbar to look like in a 1990s piece of cheap shareware:

I mean, honestly, is this some kind of joke? This interface does neither convey any informational value nor scientific professionalism (if that was intended). The only thing it conveys is your utter lack of interface design principals.

But apart from such minor issues (as you seem to think that UI design is a minor issue), the list of bugs in SPSS that I came across during a single week of working with SPSS 16.0 for Mac is mind-blowing.
  • Double-clicking a saved viewer output in the finder opens an empty data file instead. Double-clicking the output in the finder again leads to an error-message that tells me that the file is already open (which it isn't).
  • If I go through the cumbersome process of defining input parameters for a data file in text format, and save the parameters as a template for future imports, I cannot load the template the next time I want to use it. When I click on the template file in the open template-dialog, nothing happens.
  • If I select "Data... -> Merge Files -> Insert Variables", choose an external file and tell SPSS to add certain variables from that file to my current file while dropping others, the resulting syntax produces an error and nothing happens.
  • Importing variables with values that are stored in the decimal format (e. g. "4.023") from a text file produce missing values, i.e. they're not imported at all despite the fact that they're displayed correctly in the preview of the import wizard. Changing the variable type from numeric to string doesn't help.
  • The menu bar in the output viewer disappears from time to time. Only quitting and restarting SPSS brings it back.
  • When re-opening a saved viewer file, the font face of all custom-edited headlines is changed from Arial 16 to Times New Roman 12.
  • Overall performance is incredibly slow.
  • In the output-viewer, double-clicking a diagram for editing and closing it again sometimes leads to all changes being lost.
These are just the most prominent bugs I came across. I am sure that there is more where that came from. Do you have any kind of testing whatsoever at SPSS? What kind of impression do you think such experiences create? On my part, it creates the impression that you disrespect your users.

According to Eric Sink, there are three categories of software:
  • MeWare: The developer creates software. The developer uses it. Nobody else does.
  • ThemWare: The developer creates software. Other people use it. The developer does not.
  • UsWare: The developer creates software. Other people use it. The developer uses it too.
For me, SPSS is an extreme example of ThemWare. You seem to have no clue about the poor quality you're creating - at least for the Mac. This impression is extremely stark because I have to use your products alongside beautifully designed pieces of software such as bibDesk, Apple Pages, and Apple Mail.

In my opinion, there is a piece of statistical software that is just the opposite of SPSS: R. It doesn't sport a graphical interface such as SPSS (it's syntax only, like SPSS used to be), but it's certainly more powerful, creates better graphs, and is built and maintained by a community of people that care for their product and actually use it. I've been trying R alongside SPSS for six months now and I haven't come across a single bug. If R had a powerful graphical interface, your product would be off the market within a week.

My experience with SPSS 16 for Mac will make me change to R once and for all. Furthermore, I will encourage my colleagues to do the same.

Frustrated,
Bertolt Meyer

Note: The link to the three categories of software stems from Jeff Atwoods coding horror.

Update: Two more bugs I can reproduce:

  • Copy and Paste from Excel is not working
  • Importing Excel Files produces "?" as values after the 40th variable
Update 2: According to this sitemeter-entry, someone from SPSS has read this post. I wonder whether I will receive a reply.

Update 3: The story has been picked up elsewhere and SPSS replied.

Labels: , , , , ,