Beautiful Correlation Tables in R
I have achieved another victory in getting R to produce SPSS-like results. In experimental psychology, an analysis of measurement variable correlations is a common method in the course of a statistical analysis. Thus, I wanted R to produce a publication-quality output similar to SPSS: a correlation matrix of measurement variables that contains only the lower triangle of observations, where observations have two decimal digits and are flagged with stars (*, **, and ***) according to levels of statistical significance. However, as statmethods notices:
> corstarsl(swiss[,1:4])
Fertility Agriculture Examination
Fertility
Agriculture 0.35*
Examination -0.65*** -0.69***
Education -0.66*** -0.64*** 0.70***
If one employs the xtable package that produces LaTeX tables from within R, xtable(corstarsl(swiss[,1:4])) produces this:
 Isn't that beautiful? I like it a lot. Here's the code (as I said, much of it taken from here):
corstarsl <- function(x){
require(Hmisc)
x <- as.matrix(x)
R <- rcorr(x)$r
p <- rcorr(x)$P
## define notions for significance levels; spacing is important.
mystars <- ifelse(p < .001, "***", ifelse(p < .01, "** ", ifelse(p < .05, "* ", " ")))
## trunctuate the matrix that holds the correlations to two decimal
R <- format(round(cbind(rep(-1.11, ncol(x)), R), 2))[,-1]
## build a new matrix that includes the correlations with their apropriate stars
Rnew <- matrix(paste(R, mystars, sep=""), ncol=ncol(x))
diag(Rnew) <- paste(diag(R), " ", sep="")
rownames(Rnew) <- colnames(x)
colnames(Rnew) <- paste(colnames(x), "", sep="")
## remove upper triangle
Rnew <- as.matrix(Rnew)
Rnew[upper.tri(Rnew, diag = TRUE)] <- ""
Rnew <- as.data.frame(Rnew)
## remove last column and return the matrix (which is now a data frame)
Rnew <- cbind(Rnew[1:length(Rnew)-1])
return(Rnew)
}
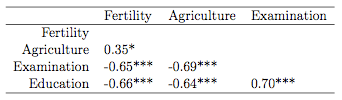
Unfortunately, neither cor( ) or cov( ) produce tests of significance, although you can use the cor.test( ) function to test a single correlation coefficient.I did a little research and found this post on the R-help list. I modified Chuck Cleland's code a little so that the following command on the swiss data frame (provided in the Hmisc package) produces a beautiful output:
> corstarsl(swiss[,1:4])
Fertility Agriculture Examination
Fertility
Agriculture 0.35*
Examination -0.65*** -0.69***
Education -0.66*** -0.64*** 0.70***
If one employs the xtable package that produces LaTeX tables from within R, xtable(corstarsl(swiss[,1:4])) produces this:
 Isn't that beautiful? I like it a lot. Here's the code (as I said, much of it taken from here):
corstarsl <- function(x){
require(Hmisc)
x <- as.matrix(x)
R <- rcorr(x)$r
p <- rcorr(x)$P
## define notions for significance levels; spacing is important.
mystars <- ifelse(p < .001, "***", ifelse(p < .01, "** ", ifelse(p < .05, "* ", " ")))
## trunctuate the matrix that holds the correlations to two decimal
R <- format(round(cbind(rep(-1.11, ncol(x)), R), 2))[,-1]
## build a new matrix that includes the correlations with their apropriate stars
Rnew <- matrix(paste(R, mystars, sep=""), ncol=ncol(x))
diag(Rnew) <- paste(diag(R), " ", sep="")
rownames(Rnew) <- colnames(x)
colnames(Rnew) <- paste(colnames(x), "", sep="")
## remove upper triangle
Rnew <- as.matrix(Rnew)
Rnew[upper.tri(Rnew, diag = TRUE)] <- ""
Rnew <- as.data.frame(Rnew)
## remove last column and return the matrix (which is now a data frame)
Rnew <- cbind(Rnew[1:length(Rnew)-1])
return(Rnew)
}
Labels: psychology, R, spss, statistics
posted by bertolt at 21:35
![]()

30 Comments:
Kinds of individual ugg rainier boots are cut from the ugg rainier skins which are sewn together by professional machines. The soles are glued to ugg boots upper. Now, you can purchase ugg ! uggs have stirred up a fashion tide and become a huge fashion craze. Enjoy UGG Australia comfort please!
Very nice! Just copied and pasted the code into R and it worked flawlessly. A fast way to get a readable table to share results with colleagues.
Thank you so much for this. Almost finished my first latex and R paper, formatted in APA style when i realised that i had no significance stars. You're a lifesaver, thank you.
Seriously helpful thanks a ton for this.
Take a look at this:
https://gist.github.com/887249
It's very similar, but uses `psych` package instead `Hmisc`
Personally, the post is in fact the most excellent on this impressive topic. I harmonize with your conclusions and will keenly look further to your future updates.
Fort Worth Brake Repair Service
The topic is remarkable. I actually never think I could have an excellent read by this time until I find out this website. I am thankful for the information. Thank you for being so kind enough to have shared your information with us. nap mat with pillow
This blog is excellent. I got many unknown information from this site. Buy Herbalife
This was very informative. I have been reading your blog a lot over the past few days and it has earned a place in my bookmarks. It is wonderful.I learn a lot from it.thanks for sharing the article. Its like you read my mind! You appear to know so much about this, like you wrote the book in it or something. I think that you could do with some pics to drive the message home a little bit, but other than that, this is great blog. domestic violence lawyer Fort Worth
thanks, this was a super useful post.
Hi there,
i don't get the same output like although I installed all necessary packages.
My output looks like this:
% latex table generated in R 2.15.1 by xtable 1.7-0 package
% Fri Oct 12 12:45:52 2012
\begin{table}[ht]
\begin{center}
\begin{tabular}{rlll}
\hline
& Fertility & Agriculture & Examination \\
\hline
Fertility & & & \\
Agriculture & 0.35* & & \\
Examination & -0.65*** & -0.69*** & \\
Education & -0.66*** & -0.64*** & 0.70*** \\
\hline
\end{tabular}
\end{center}
What to do???
Thanks!
Felix
Just wanted to add if you want Spearman's test instead, you have to add it in two lines, otherwise the stars are based on Pearson. I made that mistake and it took me a while to figure it out, since the p-values displayed are still the right ones from Spearman.
R <- rcorr(x, type="Spearman")$r
p <- rcorr(x, type="Spearman")$P
WOW this is unbelievably good. From the perspective of an R newbie where nothing ever works first time, this is AMAZING. Thank you so much!
Fantastic code!,
A lot of professional reporting standards (e.g., APA 6) elimates the "0" in front of each correlation (e.g., 0.77 = .77) because the 0 is assumed. I wonder how this package could be altered to remove the zero in the front?
- Conal
Nice topic. This help articles helps me.
Several articles on how to compute and visualize correlation matrix are also provided here :
Computing and visualizing correlation in R
The current procedure to drop the upper triangular is not optimal because it turns all numbers into characters. This may cause problems when you want to round, print in latex tables or calculate.
Therefore you better use
## remove upper triangle
Rnew[upper.tri(Rnew, diag = TRUE)] <- NA
Also, the transformation into matrix/data frame is not necessary.
electronic cigarette reviews, e cigarette, electronic cigarette, best e cigarette, ecig forum, e cig
Thanks, very useful, I just used it and it works very well!
You are amazing, thank you very much! I'm a psychology student with huge love to stats, so your blog is my perfect match :)
I'm happy about everything you bring it very interesting and helpful, thanks happy wheels , happywheels , happywheel
This comment has been removed by the author.
Any way I'll be subscribing to your feed and I hope you post again soon.
Monkey Go Happy | Monkey Go Happy 2 | Monkey Go Happy 3 | Learn To Fly | Learn To Fly2 | Learn To Fly 3 | Pacman | Pacman games | Pacman game | Mahjong |Mahjong games | Mahjong online | Happy Wheels|HappyWheels | Happy Wheels demo | cat mario 4 | cat mario 2 | cat mario
fan movie advance ticket booking
fan full movie dvdscr dvdrip dvdprint torrent download free
fan movie friday box office collection predictions
fan movie first day box office collection
fan movie poster shooting images songs
fan movie
fan movie friday box office collection
fan movie opening day box office collection
icc t20 cricket world cup live streaming 2016
icc cricket world cup book tickets online
ind vs pak match ticket booking online ww.bookmyshow.com
icc t20 crcket world cup match summary predictions who will win the match world cup
IPL 2016 Schedule
Cricbuzz.com T20 Live Score
ICC T20 World Cup 2016 Ticket Booking
IPL 2016 Schedule
Icc T20 World Cup 2016 Live Streaming
IPL 2016 Live Score
t20 World Cup 2016 Live Streaming
T20 World Cup 2016 Live Score
IPL 2016 Fixture
T20 World Cup 2016
Asia Cup T20 2016 Schedule
India Team Squad for ICC T20 World Cup 2016
New Zealand Team Players List for T20 World Cup 2016
India Vs Pakistan T20 Match 2016 Live Cricket Streaming
Like a fairytale weaved and spun with magic threads, the story of KHAS started with a dream over half a century back. A subsidiary of the Sadaqat Group, that has won respect and awards all over the world, the vision of Khas is to make the same quality available here in Pakistan.
stuffed toys
trays
t20 world cup 2016 theme song
t20 world cup 2016 live
icc T20 16 time table schedule
Shiwam In
Lyricsmate
Post a Comment
<< Home